Performance
Consolidated time-weighted returns across all client accounts, net of all fees and commissions.
Annual Returns
| Year | Return |
|---|---|
| 2025 | +16.8% |
| 2024 | +11.1% |
| 2023 | +6.4% |
| 2022 | −5.5% |
| 2021 | +17.3% |
| 2020 | +19.2% |
| 2019 | +21.8% |
Returns by Period
| Period | Annualized | Cumulative |
|---|---|---|
| 2 Year | +13.9% | +29.7% |
| 3 Year | +11.3% | +38.0% |
| 5 Year | +8.9% | +53.0% |
| 7 Year | +12.1% | +122.0% |
| Since Inception | +11.5% | +117.2% |
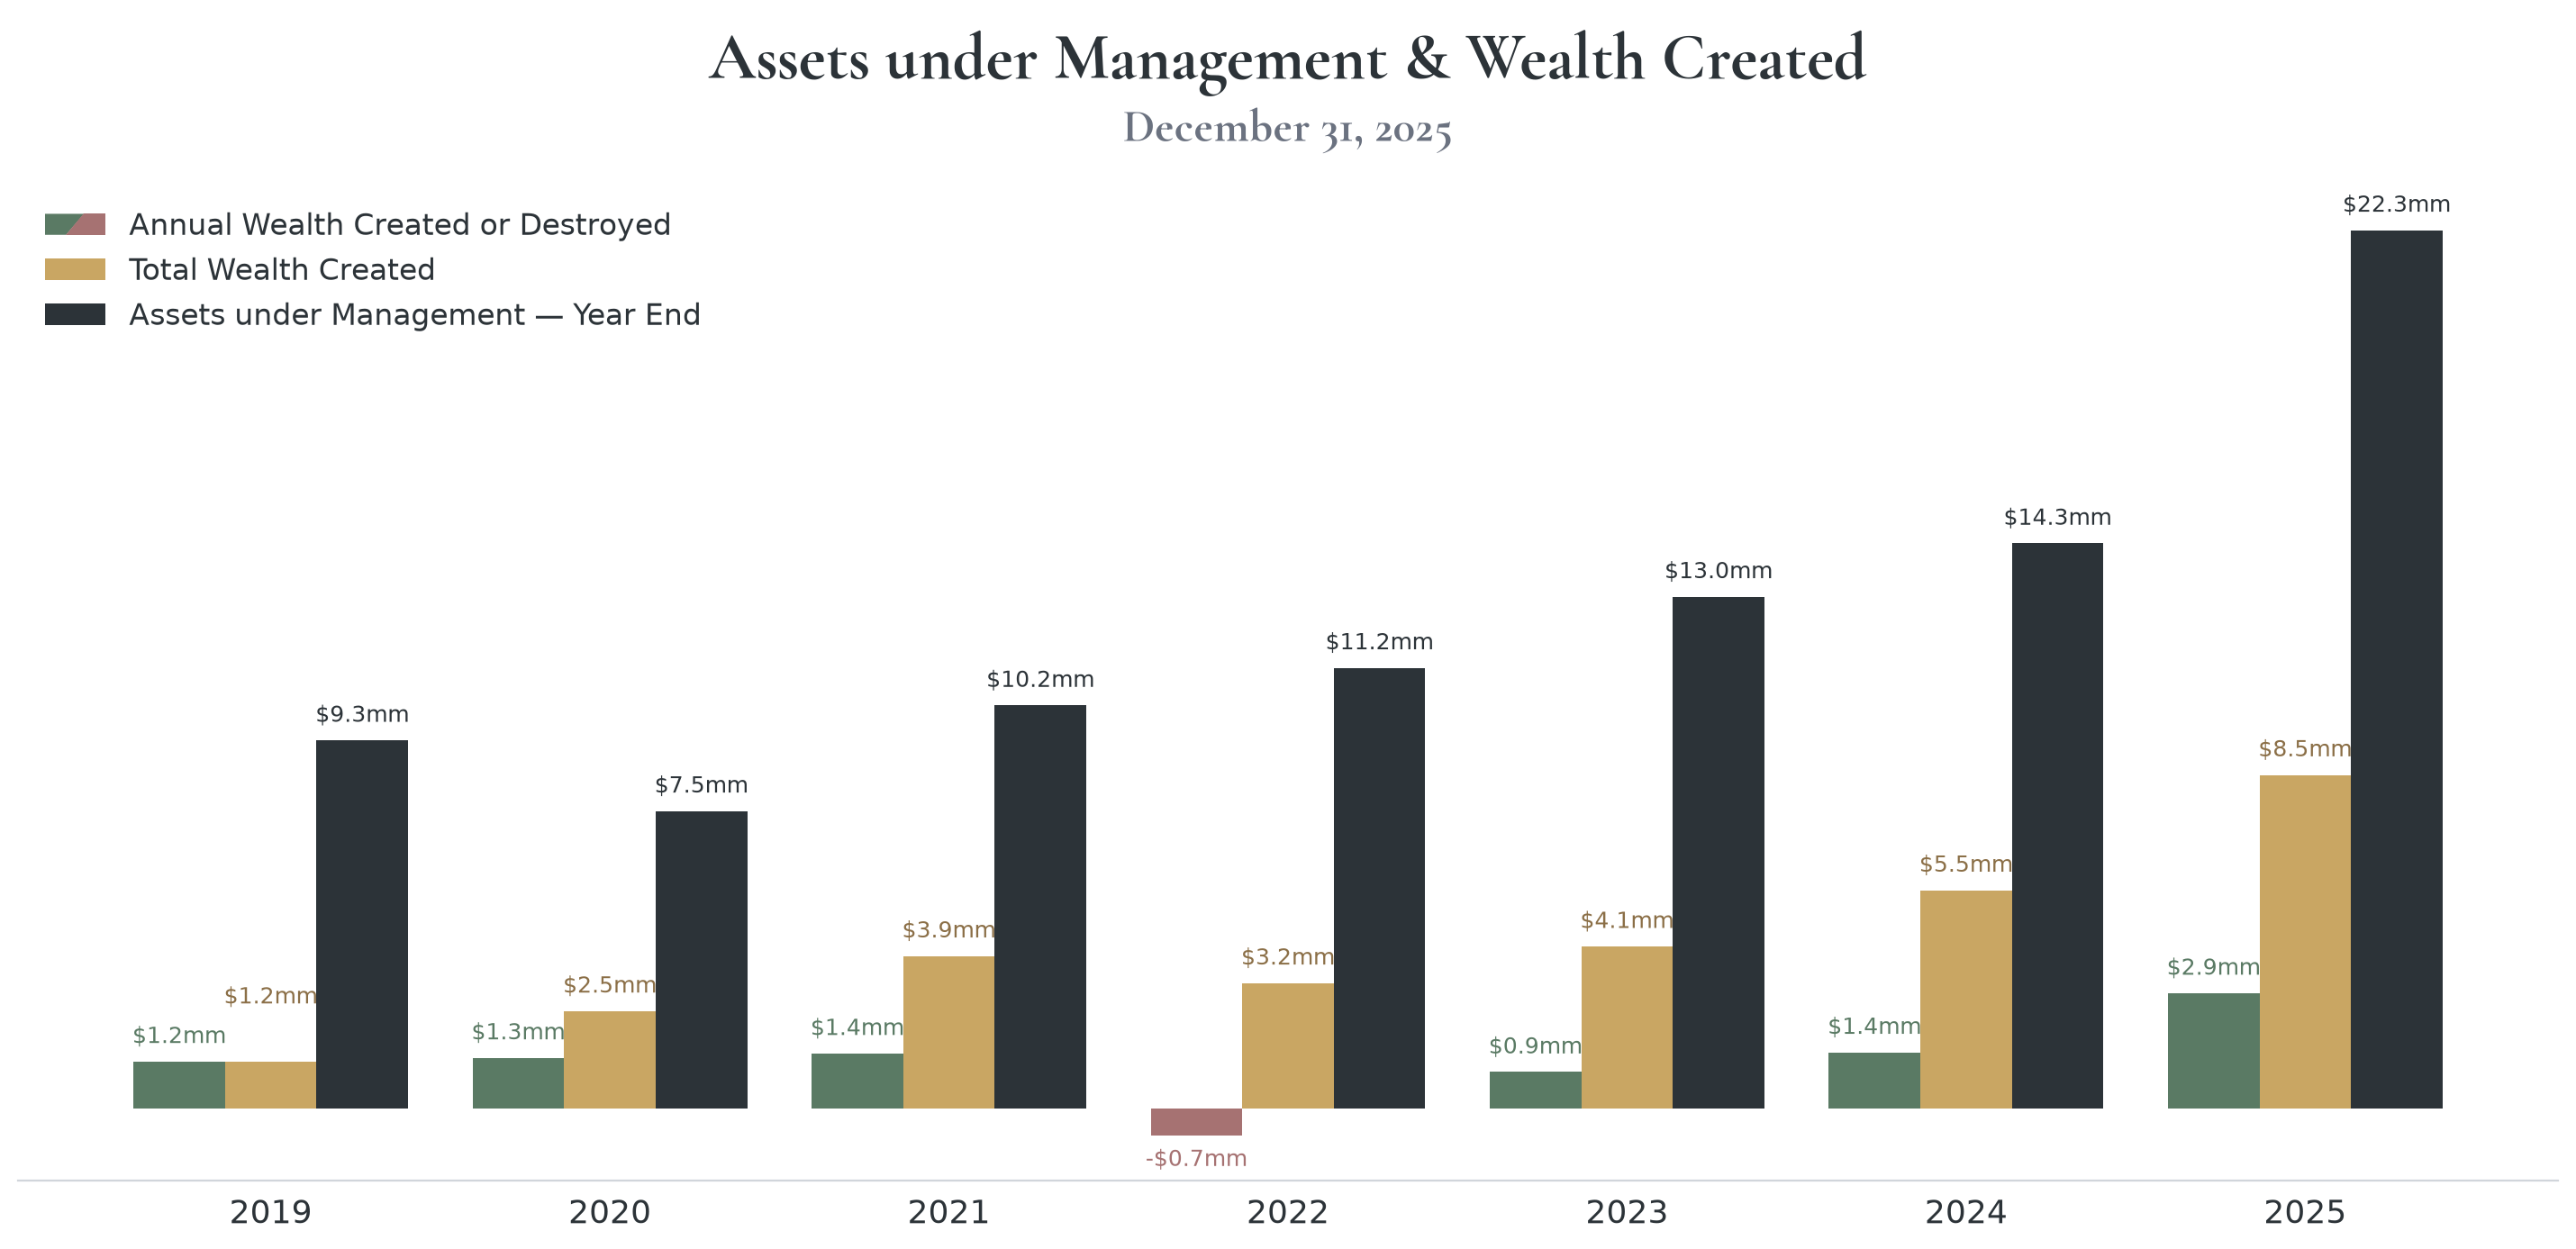
Assets under Management
| Year End | AUM | Total Wealth Created |
|---|---|---|
| 2025 | $22,254,453 | $8,454,772 |
| 2024 | $14,322,058 | $5,531,897 |
| 2023 | $12,968,780 | $4,107,271 |
| 2022 | $11,167,234 | $3,180,133 |
| 2021 | $10,214,849 | $3,865,828 |
| 2020 | $7,537,733 | $2,470,260 |
| 2019 | $9,329,858 | $1,185,446 |
Where We Invest
We go where the value is. Our equity portfolio spans 21 countries across four continents.
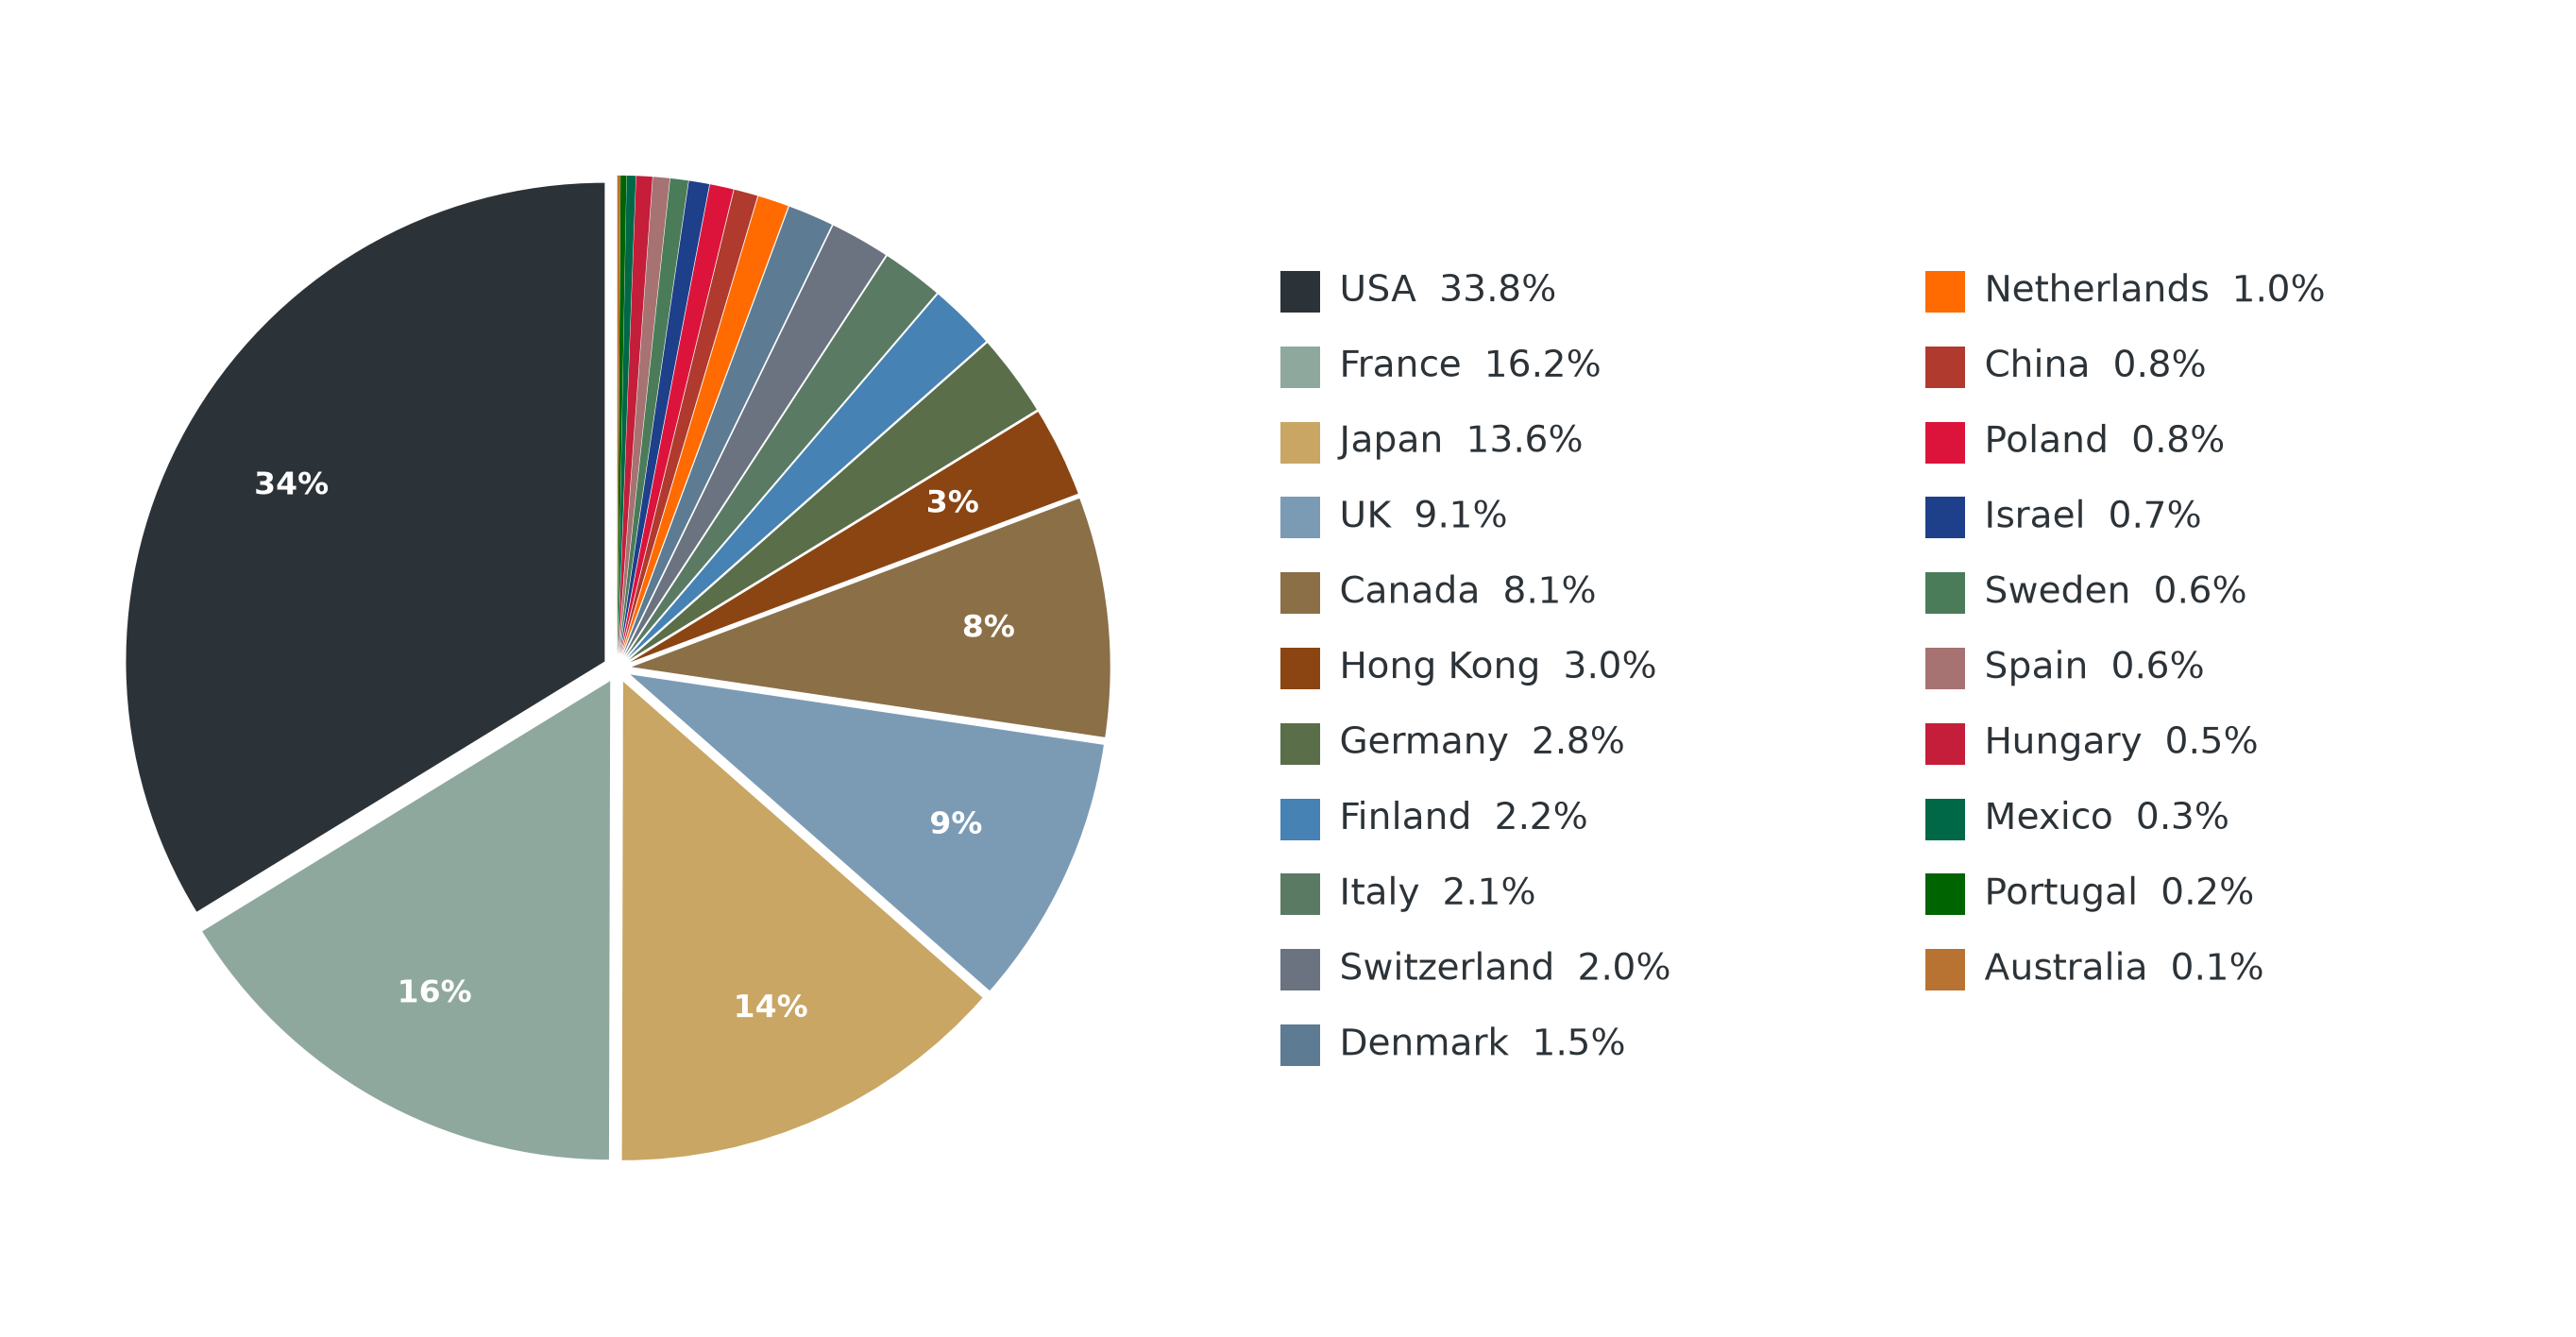
Equity portfolio by country of headquarters, measured by value, as of December 31, 2025.
How We Calculate
- S&P 500
- The S&P 500 index, comprising 500 of the largest U.S.-listed companies by market capitalization.
- S&P 75
- The 75 largest constituents of the S&P 500 by market capitalization, approximately 71% of the index by market capitalization.
- S&P 6
- Microsoft, Apple, Nvidia, Alphabet (Google), Amazon, and Meta (Facebook) — approximately 32% of the index by market capitalization.
- Medians
- Each figure is the median of the group’s values for that statistic; a company with no value for a statistic is omitted from that median. For the Enterprise Value Multiple and the Price to Earnings Ratio, a company whose three-year average earnings are negative is ranked at the expensive end rather than the cheap end before the median is taken, on the same basis for the S&P groups and for Greyfield’s holdings.
- Market Capitalization
- Total market value of a company’s outstanding shares.
- Enterprise Value
- Market Capitalization plus total debt, minus cash and equivalents.
- Price to Sales Ratio
- Market Capitalization divided by Trailing 12 Month Sales.
- Enterprise Value Multiple
- Enterprise Value divided by Average Operating Income over the Last 3 Years.
- Price to Earnings Ratio
- Market Capitalization divided by Average Net Income over the Last 3 Years.
- Net Profit Margin
- Sum of the Last 10 Years of Net Income divided by the Sum of the Last 10 Years of Sales.
- Sales Growth
- Annualized Sales Growth over the Last 10 Years.
- Dividend Yield
- Currently Indicated Annual Dividend Yield.
- Wealth Created (Destroyed)
- Ending assets minus beginning assets minus net client deposits. The dollar gain (or loss) from investment returns alone, after all fees and commissions.
- Total Wealth Created
- Cumulative wealth created (destroyed) since inception. The running total of all annual gains and losses from investment returns, after all fees and commissions.
- Country
- Where a company is headquartered, whichever exchange its shares trade on.
All returns are time-weighted, consolidated across custodians, and reported net of all fees and commissions. Return data is sourced from Interactive Brokers LLC (Flex Query) and Charles Schwab & Co., Inc. (Data Delivery). Returns are unaudited.
Disclosures
The returns on this page are the returns of all client accounts taken together, and they are not the returns of any one client. Each account is managed on a discretionary basis and tailored to its owner’s tolerance for risk. Client assets are held at Interactive Brokers LLC, at Charles Schwab & Co., Inc., or at both.
Greyfield’s performance record begins on November 19, 2018. Figures given since inception run from that day through December 31, 2025, seven years, one month and twelve days.
Investing involves the possibility of loss, and past performance is not indicative of future results. Greyfield Capital Management LLC’s Form ADV is available upon request and at adviserinfo.sec.gov.